By LEWIS JOHNSON – Co-Chief Investment Officer | February 10, 2016 “Nothing in life is so exhilarating as to be shot at without result.”
-Napoleon
-Churchill
No one would attempt to drive a car by looking only in their rear view mirror, but many investors make this mistake by paying too much attention to lagging data. We prefer to follow more forward looking data from the credit and gold markets. Understanding the simple message from these highly insightful markets is one of the greatest challenges that successful investors must overcome. When we listen to their message right now, these indicators are telling a cautionary story that the equity markets appear to be heeding, especially in the last several weeks.
Our study of cycles has us concerned about the prospects for an over-indebted world. We have studied this topic for literally thousands of hours over the last ten years. This research publication has been filled with our worries about declining credit quality and its negative impact since the spring of 2014. This does not mean that our insights will be correct – but it does mean that they will be well-informed. This week’s Trends & Tail Risks recaps how we got here but more importantly focuses on our game plan for where we are going.
How We Have Managed Risk So Far, and What Remains to be Done
Below we outline the steps that we have taken so far to make portfolios safer.
- Dramatically reduced emerging market exposure in 2013
- Bought high-quality, long duration bonds in mid 2014 while dramatically reducing lower quality bonds
- Sold many bank stocks in December of 2015 into the misplaced euphoria of the first Fed interest rate hike in eight years
- Bought U.S. Treasury bonds of the highest quality and longest duration, especially 30 year and 10 year bonds
We believe that these cumulative steps to make portfolios safer were prudent, and importantly, have been rewarded by the market. Our philosophy has always been: panic early! Beat the rush! This we have done. We believe that a further measured step is now necessary, for the reasons we outline below.
What’s New: Our Most Sensitive Indicators Flash a Warning Sign
One of our clients asked the other day: in August we rode through the volatility while making no changes. Now we are making changes. What is different now? While this publication has been the voice of caution for the last 18 months, that tone is now becoming more urgent as more of our trusted indicators begin to suggest further weakness ahead.
In general, we start the clock on looking for a peak in equities somewhere between a year and 18 months after the peak in credit quality, which we ascertain by looking at credit spreads. On that measure, the recent peak took place in June of 2014 which means January 2016 places us solidly in line with credit leading equities by 18 months. Of course, as we note above, we have been making portfolios safer during this time period. Now it is time for another step, our fifth in the last 18 months, to increase the resilience of our investments, as the following charts explain.
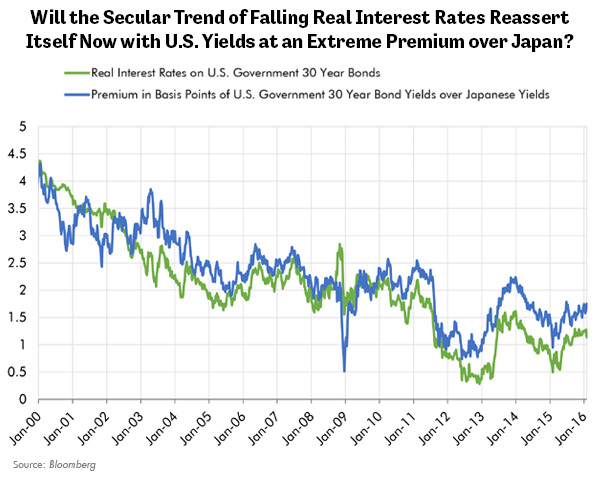
The first chart below shows the enduring secular downtrend in U.S. Treasury 30 year interest rates in two ways. In that chart the green line is real interest rates, as defined by nominal 30 year U.S. Treasury yields minus the market’s inflation expectation for the same bond as defined by the U.S. Treasury Inflation Protected (TIPS) market. The blue line is the declining premium at which U.S. Treasury 30 year interest rates trade relative to Japanese sovereign yields.
Just days ago both these trends were testing the upper range of their respective secular declines. U.S. growth had been far more durable than growth in other global markets, but in recent days, the market has begun to price in a reassertion of these secular downtrends. Look very closely at the bottom right and you may just be able to make out the small hook downward in the green line (real interest rates). In the last three weeks this measure of real interest rates has fallen from 131 basis points (bps) to 106 bps.
We believe that the secular problem of global over-indebtedness is driving these rates lower. A renewed downtrend is a cautionary sign that we can only ignore at our peril. Of course, over the last 18 months we have had investments that benefited from this trend. We believe that trend is now intensifying.
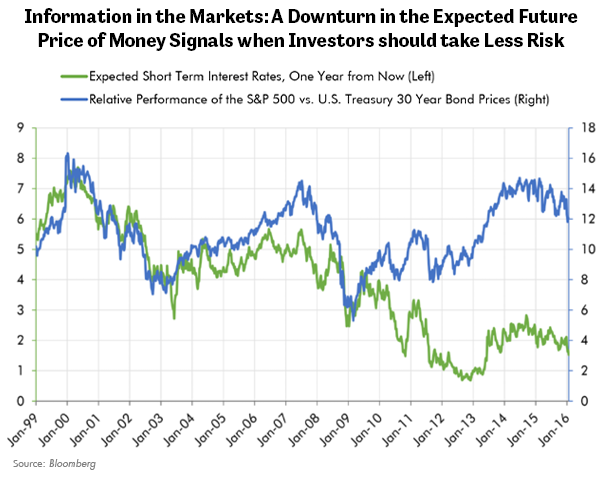
 A second chart below shows mounting evidence for a potential turn in the cycle. This chart illustrates the ratio of the S&P 500 relative to the price of the U.S. Treasury 30 year bond (in blue) versus the market’s expectation for short-term LIBOR rates one year from now. Both ratios seemingly peaked 15-18 months ago but have only now really begun to roll over. Again this is consistent with the seemingly interminable lags between when the credit market signals distress and when equities, stumbling along far behind the more insightful credit markets, begin to show material weakness.
Particularly stunning is the pace of the decline in the market’s expectations for future LIBOR. From 2.16% on the 29th of December to nearly 1.30% as of this morning. The market has priced in a brutally swift downward adjustment in its expectations of the future course of short term interest rates just as the Fed hiked interest rates for the first time in eight years. The U.S. stock market followed through with the fastest decline of the start of any year. Coincidence? We doubt it.
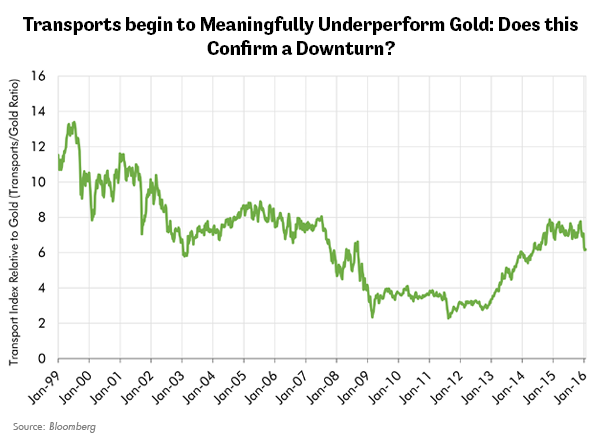
 The last chart below illustrates another key indicator: asset prices in gold terms. It’s our contention that major turns in nominal asset prices are preceded by (or at worst coincident with) changes in relative performance versus gold. Prices relative to gold are significant because they show prices against a fixed “monetary” instrument as existed under the gold standard rather than against the modern invention of floating currencies.
The chart below shows the U.S. Transportation Index divided by the price of gold. After more than a year-long topping process, transports in the last few days have broken their uptrend relative to gold. Certainly the chart below suggests that the peak may be in for transports, and arguably therefore, the U.S. economy.
 Remaining Steps: Reducing the Most Credit and Growth Sensitive Equities While Adding More Defensive Equities, U.S. Treasuries, and Gold-Related Holdings
Long-time clients have seen their portfolios laden with these defensive holdings for the last several years. An overindebted world should result in lower long-term real interest rates on the highest quality credits even as yields increase on the weakest bonds. This is a favorable environment for U.S. Treasury bonds. Furthermore this is also a great time to own defensive equities, particularly ones paying sustainable dividends. Our gold royalty positions are (finally!) doing the job for which they were so long ago selected, adding ballast to portfolios in times of rising credit stress and slowing economic growth. Higher gold prices should also be part of the future of an overindebted world. Gold prices should follow their historic pattern of rallying strongly while real interest rates fall. These defensive positions earned their place in our portfolios long ago. We do welcome, however, the market’s newfound appreciation for them!
What we are Watching, and Worrying About Now: Credit Stress at European Banks and Sovereigns
For almost two full years we have been worrying about, and writing about, our concern about the credit markets for European sovereign nations and their banks. Make no mistake: the problems underway now grabbing the headlines in Europe began with little fanfare (“Big Problems Start Small,” May 21, 2014). Timing is one of the great challenges in investing. Another challenge is to predict the various investment scenarios that will arise due to disruption from forced deleveraging of an overindebted credit and banking system. For this reason, we will continue to watch those markets carefully.
In Conclusion
This cycle will undoubtedly present its own unique challenges. Each one of the more than one hundred cycles that we have traded has taught us something new and especially to expect the unexpected! But still, our experience identifying leading indicators and causal relationships that drive cycles gives us confidence that we have the tools to navigate these challenges and to shepherd capital through these challenging markets.
We understand that our clients have dearly held goals that their wealth helps them to achieve. Whether it is college for a child or grandchild or the drive to support an honored cause for generations to come, these goals serve a purpose that is only as durable as the wealth that supports it. This is our business and our goal. We are deeply honored and humbled by the confidence our clients have placed in us. Please do not hesitate to ring us up at the office or stop by if you would like to discuss anything in this publication or anything else about the markets and how we are thinking about them.
In the meantime, the tools to success will be those that have stood the test of time: diversified portfolios formed by deeply fundamental research. Patience, as always, is the key ingredient; but so too is eternal vigilance and an open and questioning mind.