By LEWIS JOHNSON – Co-Chief Investment Officer | April 22, 2015
“It’s the little details that are vital. Little things make big things happen.”
-John Wooden
“The world is still a weird place, despite my efforts to make clear and perfect sense of it.”
-Hunter S. Thompson
“Everything has reasons, even if they’re not good ones. And the reasons have reasons.”
-Johnny Rich, The Human Script
“By becoming interested in the cause, we are less likely to dislike the effect.”
-Dale Carnegie, How to Win Friends and Influence People
“A great many people think they are thinking when they are merely rearranging their prejudices.”
-William James
“That’s been one of my mantras – focus and simplicity. Simple can be harder than complex: You have to work hard to get your thinking clean to make it simple. But it’s worth it in the end because once you get there, you can move mountains.”
– Steve Jobs
“Truth is by nature self-evident. As soon as you remove the cobwebs of ignorance that surround it, it shines clear.”
-Mahatma Gandhi
I have always been a very curious person. I can’t help but research and study some of the most paradoxical issues in the market. My goal is always a deeper understanding of how the financial world works. There are rewards for this curiosity that go beyond better knowledge: better investment results! My goal is to use this deeper understanding to safely shepherd capital through an often confusing world. If done correctly I find that such knowledge can be additive. Understanding can build upon understanding as our analytical team digs more deeply into the links between fundamental drivers and financial outcomes. Better understanding, and the patience to see that insight through to its conclusion, are the raw materials from which the best financial returns are forged.
Over the course of writing these weekly research pieces, I have outlined the three key sets of indicators that I watch for clues to where we are in the cycle. They are (1) credit, (2) gold, and (3) the inventory cycle (“Is Credit Quality Peaking?” 08/06/14, “Gold: Price vs. Relative Value” 07/23/14, “Making Volatility our Friend: Trading the Kitchin Cycle” 05/28/14). Time and again we have outlined the importance of the credit markets (“Forbidden Fruit” 12/10/14, “Our Bond Strategy: The Power of Duration” 10/08/14). Many times we have stated that the credit markets are one of the most important indicators we monitor – how credit has led many of the most important moves in the equity markets. We believe that the surest pathway for successful investing is to understand the why behind credit’s role as a leading indicator. In today’s “Trends and Tail Risks,” we do a deeper dive into credit to explain why credit is a causal driver of economic fundamentals and ask what lessons today’s credit markets may have for us.
Why we Care about Credit: Higher Credit Stress Drives Rising Unemployment
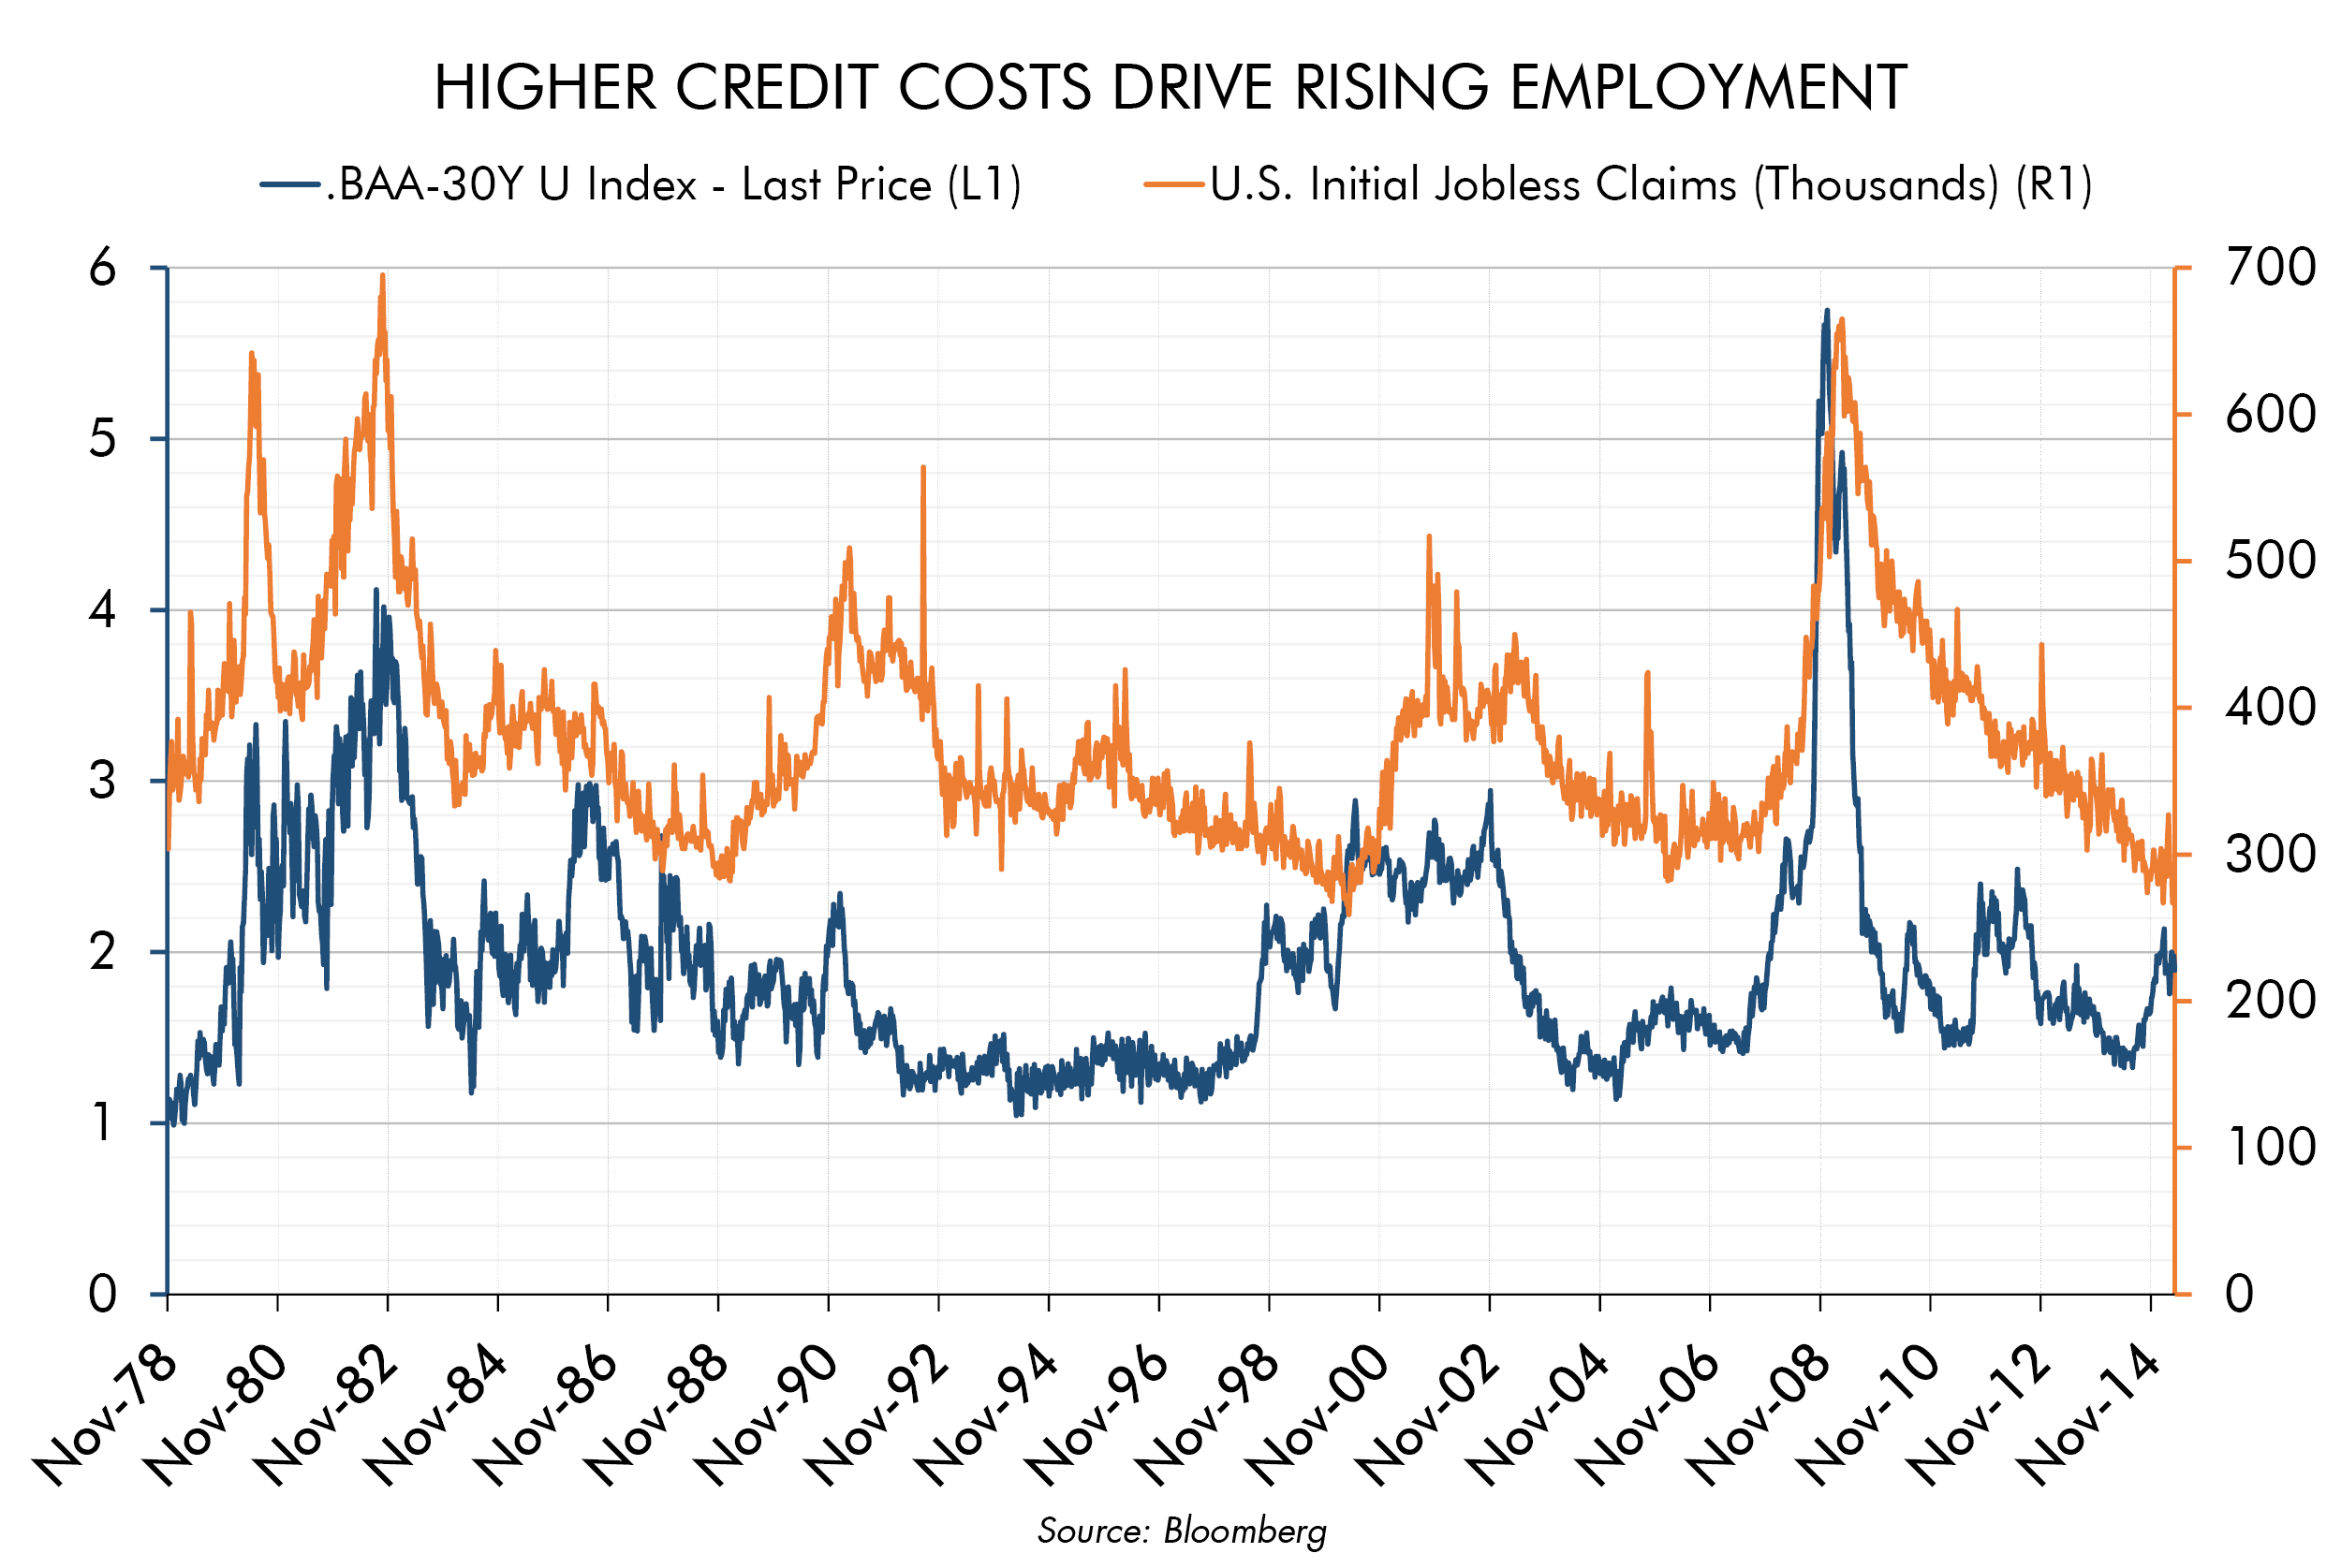
The chart below shows that credit is important because it is a causal driver of changes in employment. Let me explain. The chart displays two data series on a weekly basis since 1978. On the left axis is the premium that the market charges to a U.S. corporate borrower with a Moody’s BAA (investment grade) rating over the yield that the market charges the U.S. government for a comparable period. When that premium is rising it’s indicative of rising credit stress in the market – in that the market believes it’s necessary to charge a larger premium to borrow for investment grade rated corporate borrowers greater than less risky U.S. government debt. A rising cost of corporate credit over less risky U.S. government debt is like a tax on the corporate borrower. It demonstrates that debts that the market would once finance at a lower rate now demand higher interest rates. This is typically also accompanied by slowing issuance of corporate debt – falling credit availability for corporate America.
As the relative cost to borrow rises, business slows and becomes less profitable. Businesses are forced to become more self-financing as the availability of credit falls. Businesses have many ways that they can become more self-financing. None of them are good for growth: liquidate excess inventories, slow down investment, slow down growth initiatives, and slow down hiring or even worse to fire employees.
One measure that captures this fundamental change in the credit markets quite well is the number of U.S. initial weekly unemployment claims, which is a measure of the number of people in thousands who file for initial unemployment insurance for the first time. The chart below demonstrates a very strong correlation between a higher interest rate for corporate borrowers over government rates and the number of unemployment claims filed. This makes total sense if you think about it because one of the most sensitive measures of total corporate employment in the U.S. is the change at the margin that show up in initial unemployment claims.
Credit is a Great Leading Indicator because it is a Casual Driver of the Level of Employment
My own trading experience in the market leads me to conclude that it is changes in the credit market that drives unemployment claims. I have seen this many times. In the late 1990s, the mid 2000s and especially into the peak of credit stress in 2008, I have seen this causality at work where credit drives changes in employment. Here I must acknowledge the highly insightful research of Dr. Steve Keen who has done pioneering work on the causal dynamics of credit.
Of course, a reasonable counter-argument to the hypothesis I outline above would be that rising unemployment causes credit stress because employees are consumers and when consumers lose their jobs their incomes and thus spending drops, which is bad for the economy. This weakens credit quality. I suggest that readers interested in exploring this topic more fully reference the brilliant work of Dr. Keen on credit as a leading indicator of employment or the work of Dr. Lacy Hunt at Hoisington Management. One thing is certain: this very long-term relationship between credit spreads and initial unemployment claims demonstrates how closely the two are intertwined.
Another View of the Causality of Credit: Regression Analysis
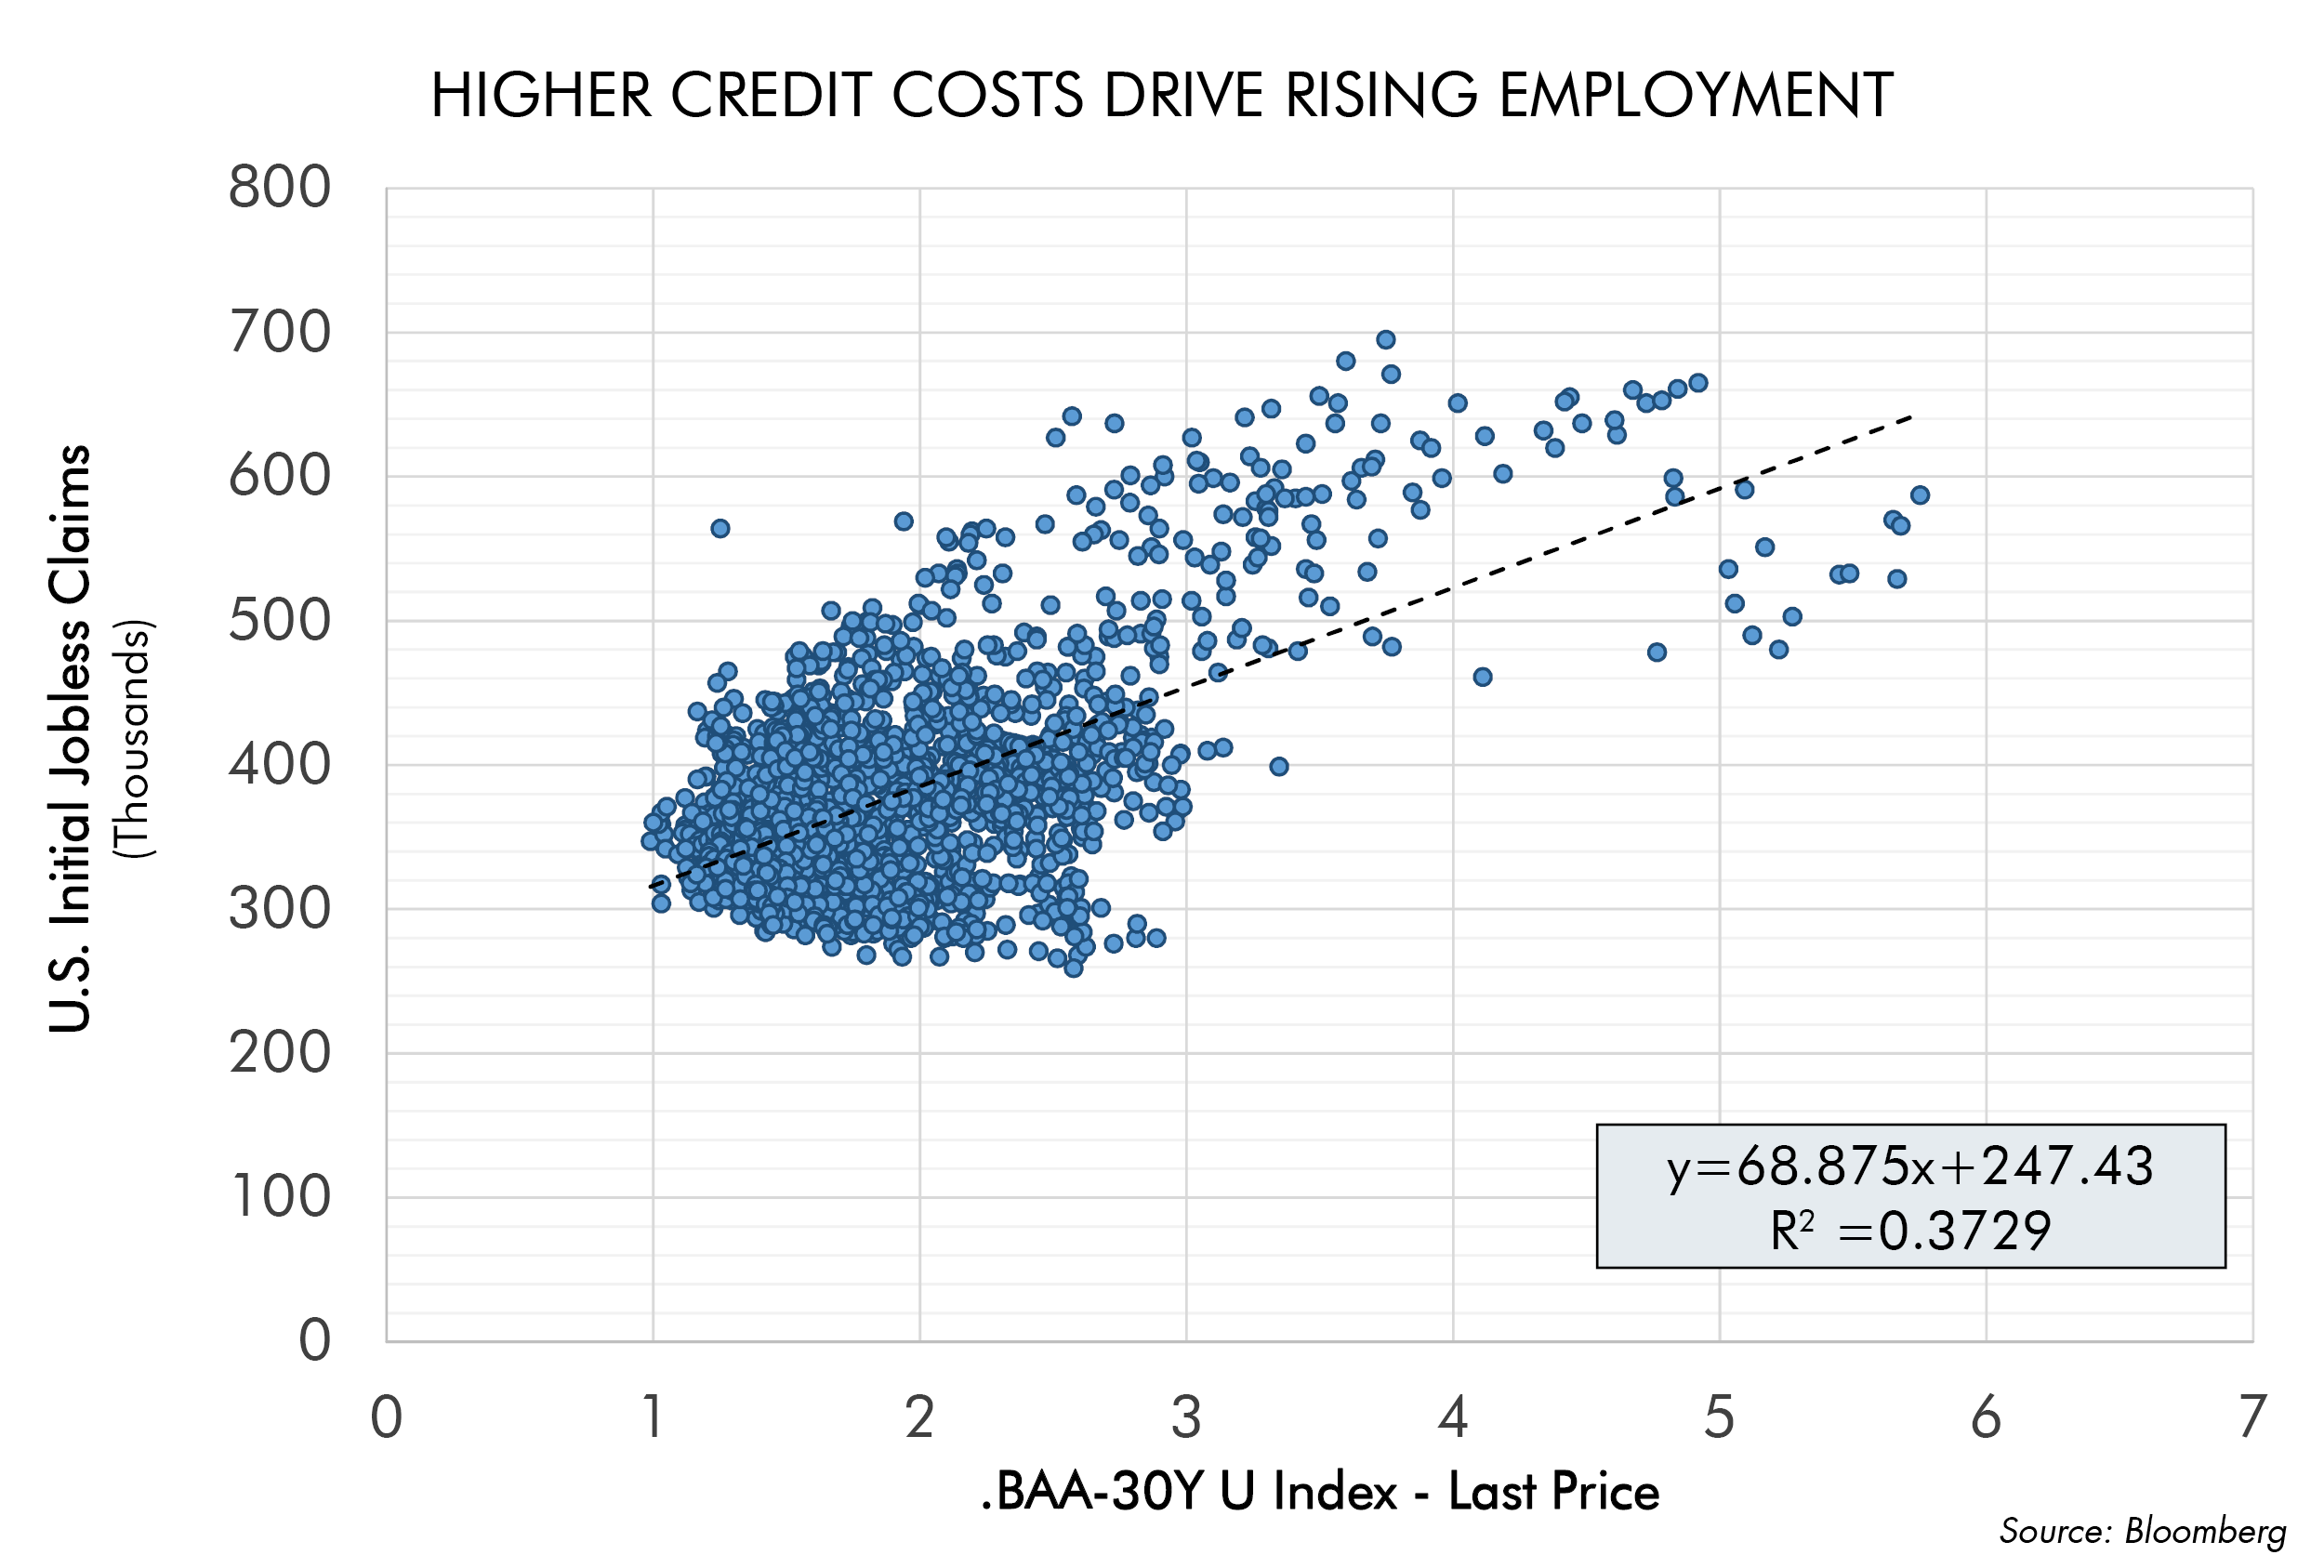
The chart below uses the same data shown above to display these results in a different way, in a scatterplot, to better isolate the relationship of these two metrics. The scatterplot below plots the data on a simple (X, Y) chart meaning that for each weekly data point we plot one point that illustrates both of these fundamental variables.
The variable displayed on the X axis (left to right) is the premium in percent that the market charges to investment grade borrowers over the yields charged to the U.S. government – the BAA-30 Year yield premium. The variable displayed on the Y axis (down to up) is the number of initial filings for weekly unemployment insurance in the United States in thousands. The more than 1,900 weeks of data shown above are plotted by their position on the X and Y axes. We then run a regression analysis that demonstrates how much of the variability of the Y axis, initial unemployment claims, can be explained by the BAA-30 Year yield premium. We find a remarkably strong relationship over time, namely that the simple knowledge of the level of BAA-30 Year yield premium can explain almost 40% (.3720 r-squared) of the level of initial unemployment claims. This is a very strong relationship for two such simple but powerful indicators.
Investment Implications: What are these Variables Saying Now?
Initial unemployment claims are near forty year lows. This seems like a highly bullish fundamental data point. However a reasonable question to ask is: if we are already near historic lows – can we really go lower? Looking at the seasonally adjusted data (INJCJC Index in Bloomberg) I can find only one week since 1978 (out of the last 1,900 or so weeks) where initial unemployment claims have been lower: at the peak of the stock market boom in 2000. Perhaps this outlier is not as extreme and as alarming as it sounds given the large overhang of long term unemployed which followed the 2008 global financial crisis. Yet at the same time now credit spreads in the U.S. are elevated. How to make sense of this disagreement? Which one of these is right?
Are these differing trends (in the short run) forecasting a potential rise in unemployment ahead? If so, this would be a development that few currently anticipate. Or is there perhaps a different interpretation? Namely, that these abnormally high credit spreads are temporary – driven to these levels by the trough of the destocking cycle that are now quickly receding. Last cycle credit quality as defined by Moody’s BAA rated bonds minus AAA rated bonds peaked in February of 2005 even though the ultimate equity market peak was not until two and a half years later. There is ample precedent for a meaningful lag between the initial peak of credit quality and what may ultimately prove to be an equity market peak. This is why we must dig more deeply into the links between higher credit spreads and a rise in initial unemployment claims.
Perhaps rather what we are seeing in the credit market is as simple as “flight to safety” capital flight driven by the credit problems in Europe seeking the comfort (or higher yields) of the U.S. sovereign debt markets, one of the world’s deepest and safest credit markets? Certainly the data demonstrate that during the sovereign debt crisis in Europe from 2011-2012 investors were very willing to receive lower yields from U.S. government debt relative to U.S. corporate investment grade bonds even while the number of initial unemployment filings kept falling. Certainly the exception of 2011-2012 demonstrated that initial unemployment claims were the factor to watch. Could this be another such exception?
One hypothesis is that this 2011-2012 period of European credit stress increased the premium the market demanded of corporate investment grade borrowers to levels that were not justified by U.S. corporate credit or even by projected employment fundamentals. Might the resurgent sovereign debt problems of Greece (“Greece: The Bank’s Problem?” 02/11/15) be behind this current disconnect between initial unemployment claims and U.S. debt spreads? Which one is right?
Should credit stress rise even while the pressures of the destocking cycle fade, that will be a troubling sign that we may need to become more concerned about the direction of U.S. credit quality. Only time will tell for sure in the short run. We will continue to monitor this data very closely.
Ultimately, we remain concerned that our most vexing problems in the credit markets remain unsolved due to continued overindebtedness and the seeming paradox of our policy leaders to choose more debt as the solution for a debt crisis. The extraordinary credit crisis of 2008 drove policy makers and central bankers to resort to extraordinary measures. Globally these efforts are working. But have these efforts finally solved our debt problems – or have they merely stabilized the markets in the short term, delaying the timing of their ultimate resolution? My fear is that these extraordinary efforts have only temporarily bandaged our credit wounds. The wounds themselves, I fear, remain unhealed and will challenge the markets again sometime in the future. One of our most important tasks is to monitor our progress along the path to this ultimate resolution of our debt problems.
In Conclusion
We believe that deeper understanding is the most sustainable path forward to better investment results. Simpler is almost invariably better – which is why we prize simplicity in our research (“Simplicity”,6/18/14). But oftentimes it takes years of study and research to reveal the simplest and most predictive relationships in the market. Thankfully we have the brilliant work of pioneering scholars such as Dr. Steve Keen and Dr. Lacy Hunt of Hoisington Management to help us develop a deeper understanding of the causal force of debt acting upon employment.
Such insights will become increasingly important as global debt levels continue to spiral higher even after the 2008 financial crisis. The study and understanding of credit will be increasingly important in our over indebted world. Those who master credit will have a competitive advantage in an ever more competitive market.
We believe that we can use this stronger foundation to construct more insightful leading indicators that may clarify some of the most important questions with which we wrestle: where we are in the cycle? What happens next?
As investors we seek to harness this insight and marry it with our in-depth fundamental analysis of stocks and bonds to identify not only the best financial instruments to own – but also when to own them! We strongly believe that the marriage of better economic understanding and deeper company-specific research is the optimal path forward to world class investment results.
CWA Asset Management Group, LLC is a registered Investment Adviser. Information presented is for education purposes only and does not intend to make an offer or solicitation for the sale or purchase of any specific securities, investments, or investment strategies. Investments involve risk and unless otherwise stated, are not guaranteed. Nothing herein should be interpreted as investment advice. Be sure to first consult with a qualified financial adviser and/or tax professional before implementing any strategy discussed herein. Such case studies are not meant to be, and may not be, representative of any portfolio or holdings of CWA Asset Management Group, LLC.
This material is solely for informational purposes and is intended only for the named recipient. Nothing contained herein constitutes investment, legal, tax or other advice nor is it to be relied on in making an investment or other decision.