By LEWIS JOHNSON – Co-Chief Investment Officer | July 24, 2014
After a long hiatus, gold’s quiet outperformance (up 9.6% YTD) is slowly working its way back into the financial pages. However, gold took its time getting back there. After all, the price of gold fell 38% from its peak in late 2011. From years of experience we have concluded that the gold market is the most sensitive market to the most important changes in the world. What is the message of gold now? In this week’s Trends and Tail Risks we examine gold’s two most important – but very different – attributes; namely, its price and its relative value, to see what they are saying about the markets.
Price of Gold
The single most helpful indicator in understanding the price of gold is real long term US government bond interest rates (after inflation). The chart below defines real rates as the nominal yield on the US thirty year bond minus the market’s inflation expectations for that same time period. The following scatter plot shows weekly data points since the start of the data in August of 1998. Each week’s value for real interest rates (x-axis) and gold (y-axis) creates one point in the scatter plot with the corresponding (X,Y) coordinates. The linear equation that drives the ‘best fit’ straight line in the graph shows that real interest rates explain 70% of the variation in gold over this time period. As real interest rates fall, gold prices rise. Gold pays no interest. Thus, the metal becomes more attractive relative to competing investments when the real yields on those investments become sufficiently low. Falling real interest rates often accompany weaker currency values, which are often reflected in a rising gold price in that currency.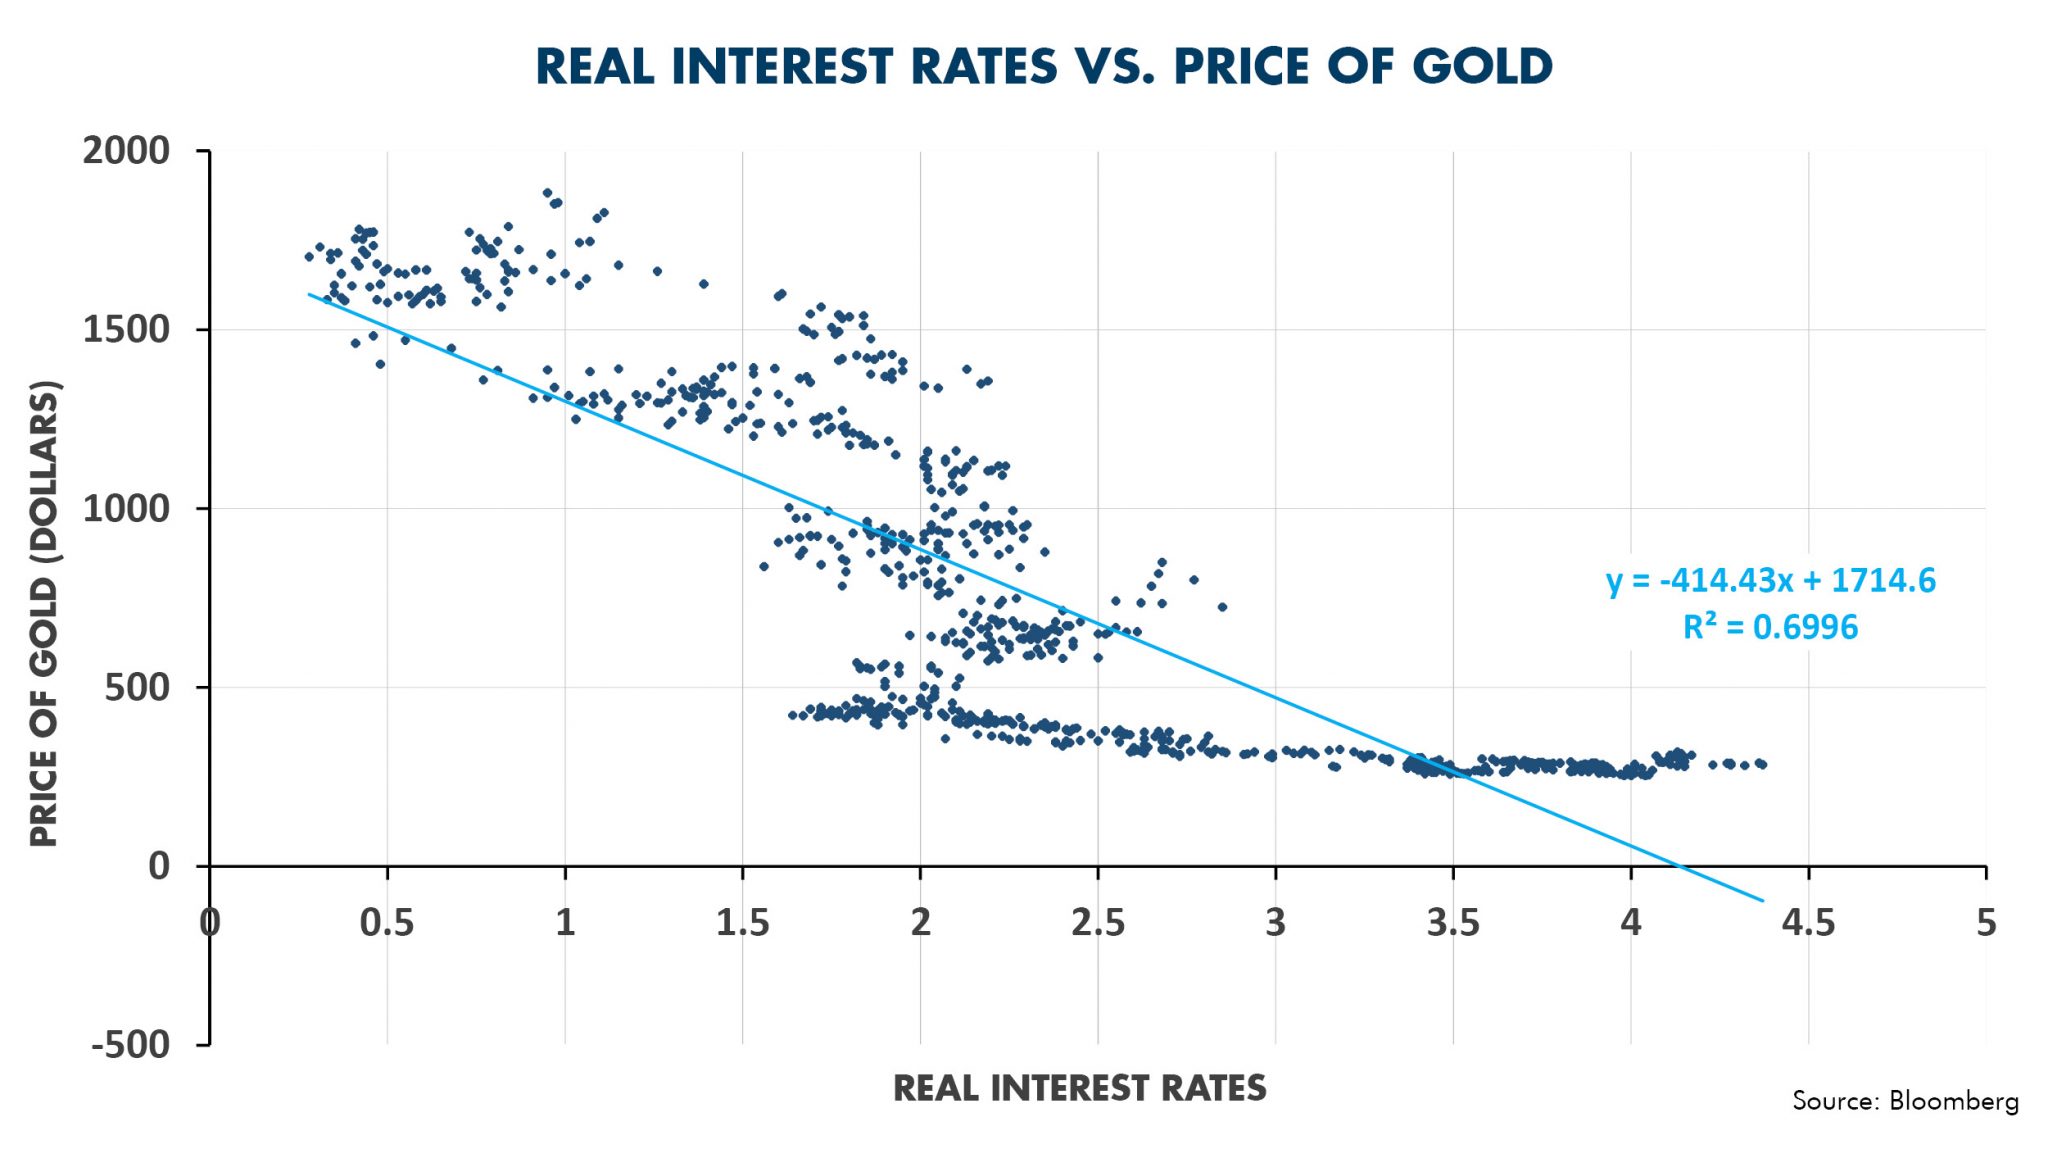
Relative Value of Gold
Gold also has a second and far less understood dimension: its relative value. I define gold’s relative value as the ratio of the gold price to whatever is being measured; for instance gold relative to the stock market, or gold relative to commodities. After much study we have concluded that gold’s relative value is driven not by real interest rates but rather by credit quality. The chart below showing Portuguese credit trends is just one example that illustrates this relationship very clearly.
The scatter plot chart below is constructed similarly to the one above, with weekly values for credit quality (x- axis) and the ratio of gold to the Portuguese stock market (y-axis). We define credit quality as the market price of the 5 year credit default swap (CDS) for Portugal. The CDS price is the market’s real time assessment of credit worthiness. Higher CDS rates indicate worsening credit quality. We chose to display the relationship between the two using a chart with a logarithmic scale to better display the relationship between the relative value of gold and Portuguese CDS. The relationship is strong with Portuguese CDS explaining a remarkable 87% of the variation in the relative value of gold versus the Portuguese stock market.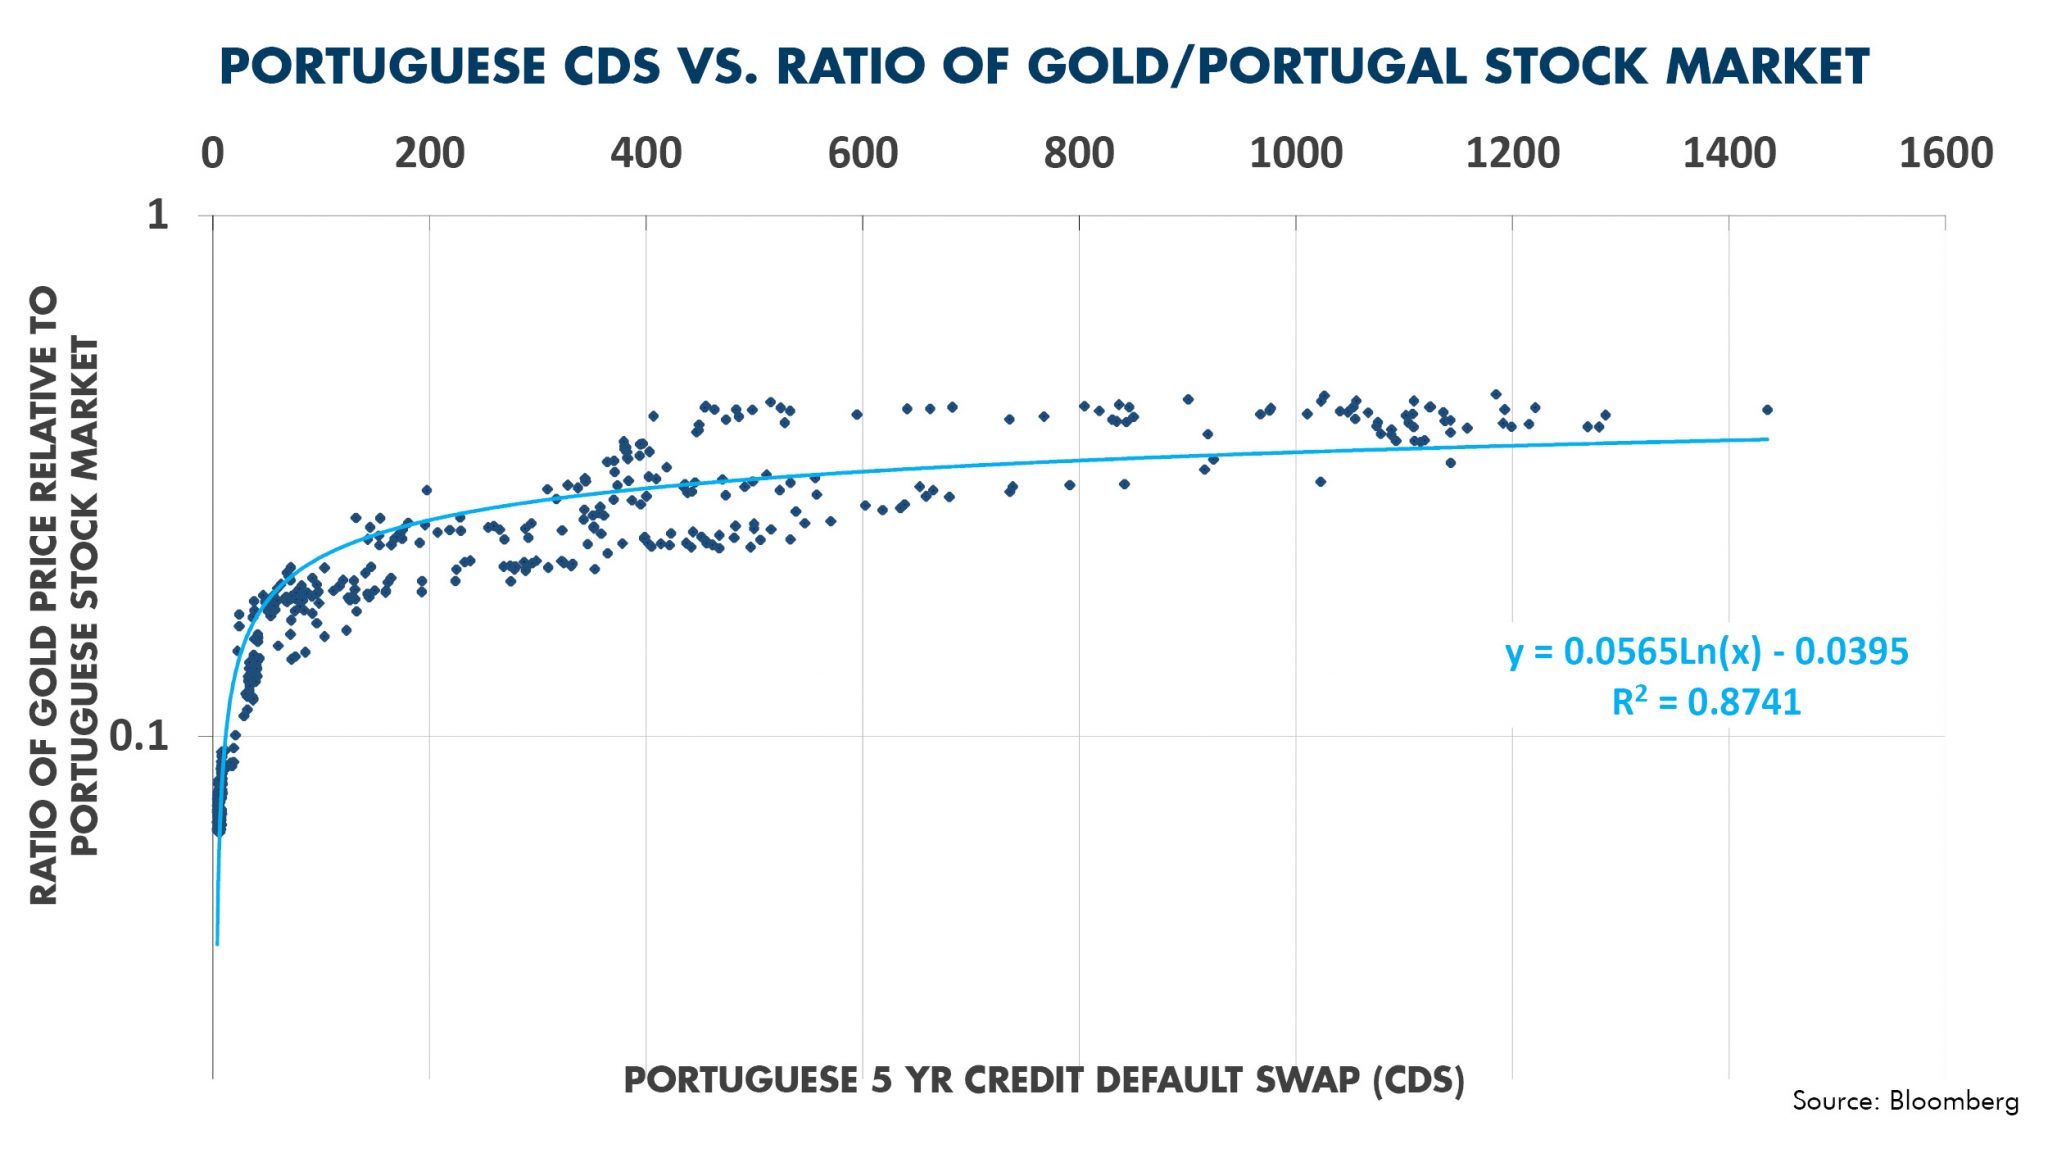
This way of looking at gold’s relative value versus a local stock market recreates the world as it used to look under the clear and simple rules of the Gold Standard. Those rules meant that countries’ currencies did not fluctuate but rather were pegged to the price to gold, which had a fixed price. The relative value of gold, in a Gold Standard world, rose in times of credit stress as asset prices fell. Since currencies were pegged to gold, falling prices were actually the same thing as a rising relative value of gold. Put another way, the same ounce of gold bought more stocks as stock prices fell.
This graph yields a powerful insight because it suggests that gold may climb in relative value versus the Portuguese stock market if CDS resume climbing. Gold shows a similar relationship when viewed relative to other markets as well. Is the recent rise in gold’s relative value versus the Portuguese stock market suggesting that increasing credit stress lies ahead in Europe? We have long believed that Europe’s highly leveraged financial system represents one of the chief tail risks that the market faces.
We find it remarkable that the market is apparently continuing to price assets under the rules of the gold standard, despite the fact that all countries years ago abandoned the Gold Standard. Could reality really be as simple as this: that although the world may have left the Gold Standard, the market never did? Perhaps this indicates that the market also values another aspect of gold: the fact that gold has no default risk. In times of rising credit stress gold’s credit quality reigns supreme. If true, this is a profound insight indeed. Both gold’s price and relative value are showing renewed signs of life.
Future editions of Trends and Tail Risks will explore these two distinct insights (gold’s price and relative value) for the investment implications we may learn by studying these markets.
CWA Asset Management Group, LLC is a registered Investment Adviser. Information presented is for education purposes only and does not intend to make an offer or solicitation for the sale or purchase of any specific securities, investments, or investment strategies. Investments involve risk and unless otherwise stated, are not guaranteed. Nothing herein should be interpreted as investment advice. Be sure to first consult with a qualified financial adviser and/or tax professional before implementing any strategy discussed herein. Such case studies are not meant to be, and may not be, representative of any portfolio or holdings of CWA Asset Management Group, LLC.
This material is solely for informational purposes and is intended only for the named recipient. Nothing contained herein constitutes investment, legal, tax or other advice nor is it to be relied on in making an investment or other decision.