By LEWIS JOHNSON – Co-Chief Investment Officer | May 07, 2014
Yields on US government 30 year bond have defied consensus expectations by falling almost 50 basis points (bps) year to date from a high of 3.98% to 3.45%. Falling long term interest rates have resulted in an 10% capital gain to those holding US government bond maturities of 25 years or longer, and an 18% capital gain year to date for those holding US government 30 year zero coupon bonds. This marks the best performance year to date since 1988. Falling growth expectations drove this bond market rally because both inflation expectations and default probabilities were largely unchanged.
Did higher mortgage rates slow housing and the economy? Is this what is driving bond prices?
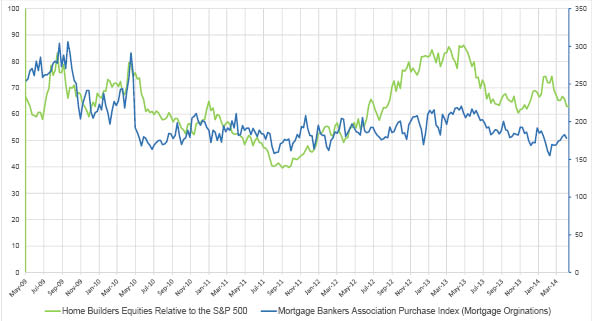
Our index of US housing equities (see below) peaked relative to the US stock market in mid May of 2013 when the Fed surprised the market with talk of ‘tapering’ its Quantitative Easing program. This Fed tightening drove a 120 bps increase in US 30 year bond yields, which made 2013 the worst year for bond prices since 1978.
The chart below shows that the Fed through its ‘taper talk’ hiked 30 year mortgage costs dramatically by 150 bps. Higher cost of borrowing drove down by 30% the index of purchase mortgage financing tracked by the Mortgage Bankers Association from May 2013 to the most recent data. The equities of publicly traded home builders immediately reacted to falling financing in May of 2013 and began to under-perform the US stock market. See below for the close relationship between these two indicators.
Home builder equities relative performance vs. SP 500 (Left), Mortgage Bankers Association Purchase Index, 1990=100 (right)
Did falling mortgage financing which began in May of 2013 slow the US economy – with a few months lag? Is this slowdown temporary? Time will tell.
Two things are clear. First, the rally in bond prices this year vindicates our counsel that clients maintain or grow exposure to longer dated bonds, which are dramatically outperforming the US equity market’s performance year to date. Second, this out-performance shows the merit of prudently and objectively seeking value overlooked by others.
CWA Asset Management Group, LLC is a registered Investment Adviser. Information presented is for education purposes only and does not intend to make an offer or solicitation for the sale or purchase of any specific securities, investments, or investment strategies. Investments involve risk and unless otherwise stated, are not guaranteed. Be sure to first consult with a qualified financial adviser and/or tax professional before implementing any strategy discussed herein.
This material is solely for informational purposes and is intended only for the named recipient. Nothing contained herein constitutes investment, legal, tax or other advice nor is it to be relied on in making an investment or other decision.

