By LEWIS JOHNSON – Co-Chief Investment Officer | June 25, 2014
Prices are everywhere. We pay prices when we want to buy things such as groceries, cars, houses, stocks and bonds. But what else should we consider with respect to prices? Prices are also the most powerful and efficient allocator of resources yet discovered. They work constantly to balance supply with demand. In this week’s Trends and Tail Risks, we take a deeper look at prices and the cyclical forces that act upon them.
Supply & Demand
Price is the equivalent of a traffic cop who keeps the traffic flowing smoothly at a busy intersection. Below we build up how prices work their magic. Prices are driven by the interaction of two variables: supply and demand.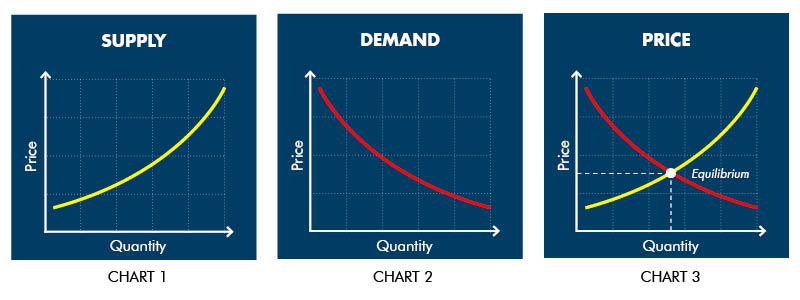 Supply Curve (chart 1): The upward slope shows the cumulative aggregate supply that may be called forth at increasingly higher prices. The supply curve is also a ranking of suppliers (producers) from the lowest marginal cost of production to the highest.
Demand Curve (chart 2): The downward slope illustrates the rise of aggregate demand as prices fall.
Price (chart 3): Microeconomics tells us that price will equal the point where aggregate demand intersects the cumulative supply curve.
We can take the price set by the market and work backwards to examine what assumptions the market is pricing in about supply and demand. For instance, in late November 2008, the price of scrap steel had crashed during a violent inventory destocking cycle. The scrap price intersected the cumulative global supply curve at such a low price for pig iron, a scrap substitute, that only 20% of the world’s producers had an incentive to operate (had a marginal cost of production below the market price). Sure demand was down but had global demand really crashed 80%, and if so could it really stay that low? The answer was clearly no. The inventory destocking cycle had driven prices far below sustainable levels.
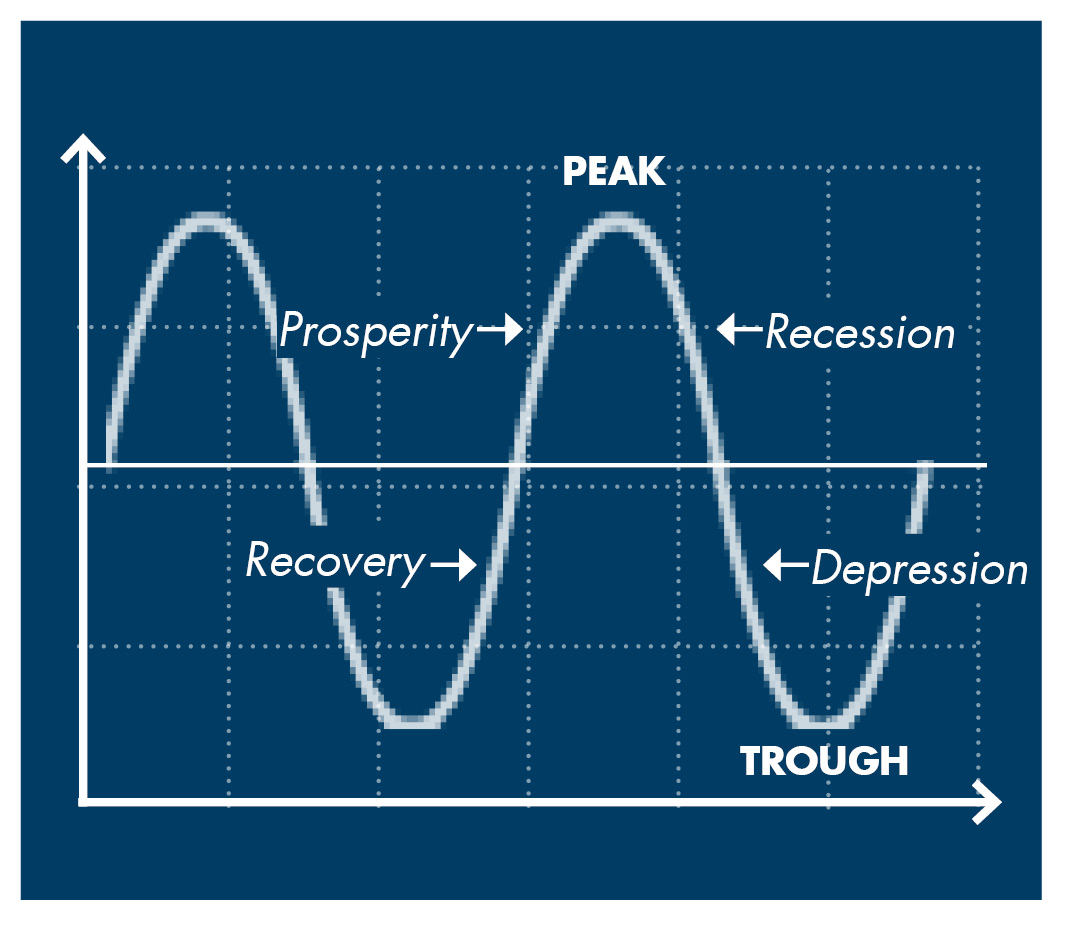
Cycles
Cycles can create havoc by driving prices up and down. Our understanding of these cycles and how they interact can be a key competitive advantage. Often we find our best investment opportunities in markets where cyclical forces have driven prices too far in either direction and are in need of correcting back to equilibrium. Joseph Schumpeter in his 1939 work “Business Cycles” classified these cycles into four different types:
- Kitchin inventory cycles of 40 month duration
- Juglar business investment cycles of 9.5 year duration
- Kuznets real estate/infrastructure investment cycles of 18 year duration
- Kondratiev cycles of credit/innovation of 56 year duration
We explored the Kitchin Inventory Cycle in past research, and will devote future articles to explaining each of these other important cycles. We have studied these cycles for years in order to learn what each one can teach us. Again and again the same patterns repeat, only the name of the markets and the dates change. The dates of cyclical peaks and troughs in particular can yield powerful insights into future economic trends. For instance, most investors enjoying the equity and real estate booms of 2006 – 2007 would have benefited immensely from the knowledge that the Kuznets cycle was expected to trough in 2008, 18 years after its last trough during the 1990 savings and loan crash and 17 years after the 1973/74 global crash.
Prices are constantly at work, allocating resources in markets everywhere. Prices can periodically find themselves driven to temporary extremes by these powerful cycles. Understanding these cycles and their changing influence on prices can help our investments be successful. We have scholars such as Joseph Schumpeter to thank. Seventy-five years ago, he laid out the principles which can help us avoid losses and make money even today.
CWA Asset Management Group, LLC is a registered Investment Adviser. Information presented is for education purposes only and does not intend to make an offer or solicitation for the sale or purchase of any specific securities, investments, or investment strategies. Investments involve risk and unless otherwise stated, are not guaranteed. Nothing herein should be interpreted as investment advice. Be sure to first consult with a qualified financial adviser and/or tax professional before implementing any strategy discussed herein. Such case studies are not meant to be, and may not be, representative of any portfolio or holdings of CWA Asset Management Group, LLC.
This material is solely for informational purposes and is intended only for the named recipient. Nothing contained herein constitutes investment, legal, tax or other advice nor is it to be relied on in making an investment or other decision.