Chief Conclusion
Today the Dow Jones Industrial Average hit 20,000. Yet we now find ourselves deep into the fourth longest expansion in recent history. For good reason, investors are asking if this aging bull market can extend for longer than most anticipate? Or are we already into a danger zone where the odds are stacked against investors? In today’s “Trends and Tail Risks” we share the insights of the yield curve, one of our most trusted indicators, into this important question.
Today the Dow Jones Industrial Average crossed 20,000 for the first time, which is reason for all investors to celebrate. But today’s investment environment remains challenging and not without risk. For instance, the investment publication Barron’s in September ran with a cover “Strategists say Beware the Bear.” Three months later the cover read “This Bull Market has Legs.” What to believe? Who should we trust?
After nearly twenty years in the financial research business I have seen many experts come and go. There is one expert, however, whose insight I have learned to trust: the yield curve. In today’s “Trends and Tail Risks” I review what the yield curve is saying now and what it means for the world of investing.
Where are we in the Cycle?
This is one of the most important and difficult questions that we must answer when we think about the right mix of investments to own. Get too cautious too early, and a bond-heavy portfolio will underperform into the cycle’s peak. Remain too bullish for too long, and the decline from the peak can be punishing. Given our uncertain world, what is the right mix of stocks and bonds to own?
We first outlined the business cycle and the forces behind it in June of 2015 (Demystifying the Business Cycle). We noted then that it would be reasonable to expect a peak in this cycle sometime around its average age of 9.5 years from the last peak in 2007, which would suggest the rising odds of a peak in 2017. Now, eighteen months later, what is the verdict of the yield curve on the cycle?
The Yield Curve: Watch its Shape
The yield curve is a fancy word for the difference in interest rates between bonds that mature at different dates. The yield curve to which I pay the most attention is that in the U.S. government bond market. Below I illustrate the difference between the yields on the U.S. government bond maturing in five years and that of the U.S. government bond maturing in 30 years.
The yields on these bonds reflect investor expectations about many things, such as future growth rates and inflation. As the yields on these bonds change, the “shape” of the yield curve changes. The shape of the yield curve is what matters the most. Today, thirty year bond yields are 1.11% higher (111 basis points) than those on five year bonds.
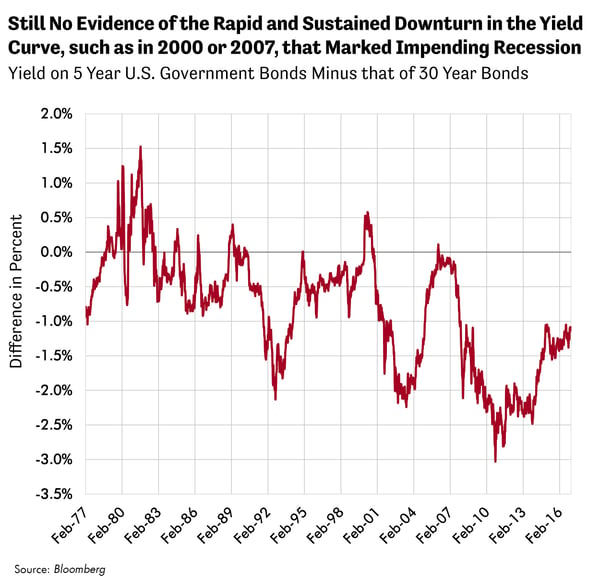
One of the most meaningful moves that can happen in the yield curve is when the line starts to fall dramatically, such as in 2000 and 2007. These rapid changes in the shape of the yield curve marked the peak in the business cycle. Slowdown and recession immediately followed.
During 2000 and again in 2007, rapidly falling yields on five year bonds drove the yield curve lower. The reason? The economy was slowing. The market was (correctly) forecasting that the U.S. Federal Reserve would begin to cut interest rates in the hopes of cushioning the downcycle. Shorter term bond yields fell dramatically, in a stark warning to investors.
Notably, the market began to reduce yields well in advance of reductions by the U.S. Federal Reserve, a point we first made in November of 2015 (The Market Leads and the Fed Follows). So those who closely watched the yield curve - and understood its message - had a leg up on their competition and the market, getting a clear read on what was next before the Fed had even begun to cut interest rates. Those investors who correctly understood, and acted upon, the message of the yield curve could have spared themselves from the bruising losses of 50% in the U.S. equity market during these “unexpected” recessions.
What Happens Now? What Will the Next Move in the Yield Curve Mean?
As fiduciaries, we are responsible for the thoughtful and prudent management of our client’s wealth. This holds us to a higher standard and makes us ask pointed and uncomfortable questions - even on such seemingly carefree days as today, with the Dow Jones Industrial Average crossing 20,000 to hit a new all-time high.
The shape of the yield curve has been relatively unchanged for the last two years. Should our ongoing bull market go from strength to strength, we can anticipate that the yield curve will validate this message by flattening or even rising further, with shorter term yields rising more quickly than longer term yields. If, however, the economy were nearing an economic slowdown, then the yield curve has demonstrated its ability to warn investors by falling.
We remain open-minded about either outcome, with a healthy respect for the advancing age of this current bull market cycle as we near the time window during which we can reasonably expect both a peak in the inventory cycle and a peak in the business cycle (Navigating Confused Seas 12.2016). We believe that the yield curve may hold the key to this and other important questions with which today’s investors must wrestle.
In Conclusion
We use helpful indicators such as the yield curve to try to answer important questions such as “where are we in the cycle?” The answer to this question has a meaningful impact upon our asset allocation, on the ideal mix of stocks versus bonds that we think is best to own in the portfolio. The answer to this question also colors how we think about the tradeoffs of owning a more cyclical or economically sensitive equity relative to, for instance, a steadier growth company. However, what does not change in our investment process is the constant application of fundamental research to identify the best stocks and bonds with which to confront an ever-changing and uncertain future.•