By LEWIS JOHNSON – Co-Chief Investment Officer | April 20, 2016 “People learn as they teach.”
– Warren Buffett
– Seneca
Microeconomics is the study of decision making and incentives by individual sellers and buyers in a market, and how their free interactions guide the optimal allocation of resources – what Adam Smith called the “invisible hand.” Markets are nothing more than the sum of all the individual decisions within them. By truly understanding the incentives and responses of one player in the market, you may come to understand that market as a whole, as we explain below.
The chart below is one that many of us have seen before, long ago, in our microeconomics text book: the supply & demand graph.
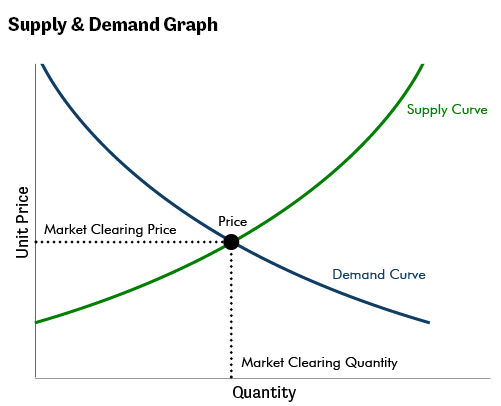 This graph is composed of two lines – a downward sloping demand line and an upward sloping supply curve. The demand curve is simple. It slopes down because consumers will buy more of a given good at a lower price than they will at a higher price. The supply curve slopes upward because producers are willing to supply a higher quantity when they have an incentive to do so, when prices are higher.
Price marks the intersection where these two curves meet. This is where supply and demand are in balance. So to understand the incentives of producers, consider the market clearing price because it determines the quantity that producers are willing to supply. As prices rise, producers respond to this incentive by increasing production. In today’s “Trends and Tail Risks,” we do a deep dive into the supply curve. The supply curve is where the magic happens.
Price Allocating Resources: The Role of the Supply Curve
We can construct the upward sloping supply curve for any commodity by ranking producers by their marginal cost of production from lowest to highest. As price moves higher, a greater portion of producers on the curve receive the incentive to produce; specifically expressed as a price that is above their marginal cost of production. This is how price allocates resources. Price moves up the curve when the market seeks more supply, and moves down the curve to shut down excess, high cost capacity in times of oversupply.
All producers are not alike. They have a different cost structure. At the bottom of the cost curve, on the left, are the lowest cost producers. These producers tend to operate at maximum capacity because the price represented by the demand line typically resides far above them – farther to the right, higher up the supply curve. Higher cost producers, however, at the upper end of the cost curve, live a more precarious existence. Their production is only needed in boom times of high demand, when the lowest cost producers do not have sufficient supply capacity to meet the market’s needs.
Should oversupply develop, as it has for the last few years in the crude oil market, high cost producers may find that the market does not need their production. The market sends this message loud and clear by offering a price that languishes below these high cost producers’ marginal cost of production. This leads to cash losses on every unit made by the high cost producer, which can bankrupt such producers over time even if the producer has no debt on its balance sheet.
Worst of all, if that high cost producer is indebted, the odds of a fatal outcome for the company’s shareholders rise dramatically. Sadly this is just where much of the once-booming high-cost U.S. shale oil producers now find themselves. Debt holders as well may find the value of their bonds compromised. At the peak of the boom, almost 20% of all the high yield debt issued in the U.S. was borrowed by the energy sector. Using debt to finance high cost production is one of the fastest and easiest ways to get yourself in a lot of trouble as an investor.
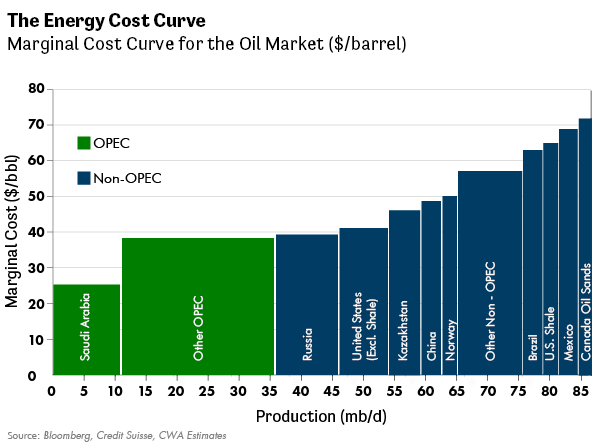 The supply curve shown above for crude oil, illustrates the marginal cost of production for each major producing country. Saudi Arabia remains the world’s low cost producer, at the low end or “bottom” of the cost curve. This means that its production cost is very low relative to the market clearing price. Accordingly, the market is giving Saudi Arabia the incentive to produce at maximum capacity. In times of market oversupply, however, such as now, the Saudis have been open to curtailing their own production in order to lead the OPEC cartel to reduce its production. If the market is starved of low cost capacity, prices must rise in order to incent higher cost producers to make up the slack. This supply management among the cartel’s producers can artificially raise the market clearing price of oil.
Let your eye wander to the upper right hand corner of the cost curve and you see that U.S. shale oil capacity has a marginal cost of production near $68/barrel. This price is far above today’s prevailing price of crude oil. Accordingly a tremendous amount of current U.S. shale oil capacity is losing money right now. Of course, when the price of crude oil was over $100/bbl, not that long ago, supply had not yet expanded enough to tip the market into oversupply. But with high cost U.S. producers earning more than 100% return on their investments, the incentive to over-expand supply was surely there.
Were such high returns, as a high cost producer, sustainable? Or rather were they only a function of a very strong cycle? Now we know the answer. These companies should have followed the advice of Warren Buffett and said “no” to the debt-funded expansion of high-cost capacity. Sadly this was not the case. Oversupply arrived in time. Carnage followed in its wake.
Volatility Creates Opportunity
Long-time clients will understand when they see the graph above the reason why portfolios were bereft of energy exposure during the height of the shale oil boom. Literally hundreds and hundreds of billions of dollars were invested in U.S. shale oil capacity during the boom years. Whenever we see high cost producers aggressively expand capacity, disaster typically follows. This time was no different. The merciless logic of the marginal cost curve had its way with these flawed investments. A huge portion of this capital has been utterly destroyed, never to return. The good news for us is that the unfolding disaster in energy is depressing the prices of even the lowest cost and best managed energy producers. These are the companies in which we are now investing.
Investing as Applied Microeconomics
Hindsight is 20/20. In retrospect, we can see each step leading to the disaster in crude oil, ultimately resulting in collapsed equity prices, defaulted debts, and rising financial distress in the U.S. Shale Oil sector. This disaster is now our opportunity, and we are aggressively taking advantage of it. But make no mistake: the very shape and slope of the cumulative cost curve were a silent warning that many shale oil companies did not heed. Frankly this is the nature of cycles – to surprise market participants through greater than expected volatility, with higher peaks and deeper troughs than anyone would have believed. We constantly tell our younger analysts “Welcome to investing, where the impossible happens every day!” Some lessons are best not to learn from experience.
Cycles are all about unexpected events. Try as we might, no one has a crystal ball. What we can do as investors is to prepare for the unexpected by investing in well-capitalized, low cost producers at the most stressful part of the cycle, when the valuation of even the best producers are distressed. We believe that time is now. And so we have been increasing our investments in the crude oil sector, and other depressed commodity sectors as well, over the last few months.
Periods of the greatest short term distress have, in our experience, tended to promote the highest returns going forward. Not all at once, in fact, sometimes taking many years. This is why our counsel is always for patience. But for thoughtful investors whose task it is to place capital at risk, such periodic disasters are a welcome opportunity to be seized. They offer the welcome prospect of limited downside but meaningful upside, while being “paid to wait” through sustainable dividends.
But never forget that the simplicity of microeconomics is always behind the scenes, working as Adam Smith’s “invisible hand” to allocate resources. When we do invest in order to seize such bargain opportunities, we are counting on the same forces that created the disaster in the first place to fix the disaster. The lessons of microeconomics have taught us to invest in low cost producers with the best balance sheets. With these investments we hope to build resilient portfolios that can weather an uncertain future.
–
We would like to gratefully acknowledge the welcome contributions of Zev Abraham, our highly experienced analyst, in this week’s Trends and Tail Risks.